Không có cách nào tối ưu cả, chỉ có cách tối ưu nhất có thể, kết hợp nhiều điều kiện để chọn thời điểm đánh và ngừng đánh sóng để hạn chế rủi ro. Về chỉ báo kỹ thuật thì có cách thống kê xác suất khi dùng một hoặc hai hoặc nhiều hơn hai để tìm điểm vào có xác suất tốt nhất. Ví dụ DIG (mã đầu cơ tăng giảm nhiều trong thời gian chu kỳ gần đây).
Về chỉ báo, code bên dưới.
//@version=5
indicator("Winrate calculate table",overlay = true,max_lines_count = 500,max_labels_count = 500)

type Dat
    matrix<int> MTX
    matrix<float> PNL
    matrix<float> PLOT
    matrix<float> Maxprofit
    array<color> Col
    array<float> MAXPF
    array<float> MAXPNL
    array<float> MAXWin
    array<bool> Signals
    array<float> MAXBOX
    array<box> Box
    array<float> Highs
    array<float> LOWS
    array<label> Labels
    map<string, color> Colors

var BackTest = Dat.new(
     matrix.new<int>(7, 2, 0),
     matrix.new<float>(7, 2, 0),
     matrix.new<float>(7, 3, 0),
     matrix.new<float>(7, 3, 0),
     array.new_color(7,color.black),
     array.new_float(7),
     array.new_float(7),
     array.new_float(7),
     array.new_float(7),
     array.new_float(1,0),
     array.new_box(14),
     array.new_float(50),
     array.new_float(50),
     array.new_label(7),
     map.new<string, color>()

     )

if barstate.isfirst
    BackTest.Colors.put("Black" , color.black)
    BackTest.Colors.put("Green" , color.green)
    BackTest.Colors.put("Red"   , color.red)
    BackTest.Colors.put("Select" , color.green)

array<string> columns                  =
     array.from('Ratio','Total Trades','Wins','Losses','Winrate','PF','PNL % ')

EXTDeal             = false
var bool Shape      = false
string BACKDATE     =  "I. Backtest date range"
string DASHGROUP    =  "II. DASHGROUP Settings"
string ENTRYG       =  "III. Entry Setup Settings"
string DYNAMICSLG   =  "IV. Stoploss Settings"
string RISKGROUP    =  "V. Risk to Reward Settings"
string VISUAL       =  "VI. Visuals Settings"
string EXT          =  "      A. External indicator Settings"
string INT          =  "      B. Internal Settings"
string _AROON       =  "      1. Aroon Settings"
string _AO          =  "      2. AO Settings"
string _RSI         =  "      3. RSI Settings"
string _MACD        =  "      4. MACD Settings"
string _PSAR        =  "      5. PSAR Settings"
string _STOCH       =  "      6. STOCH Settings"
string _STOCHRSI    =  "      7. STOCH RSI Settings"
string _MA          =  "      8. Moving Avg Settings"
string _ST          =  "      9. SuperTrend Settings"
string NAME         =  "Backtester table"
string SLZ2TOOL     = "Select Which Stoploss Type you wanna use ?! Dynamic SL or Fixed SL input"
string RRTPTIP      = "When Dynamic system is selected this acts as Level Ratio , else its Fixed Take profit input"
string EXTIP        = "Select external indicator plot"

bool limitRange     = input.bool(title='Backtest Date', defval=false, group=BACKDATE)
int Stime           = input.time(defval=timestamp('31 Dec 2000 00:00 +0000'), title='Start Time', group=BACKDATE)
int Etime           = input.time(defval=timestamp('31 Dec 2080 00:00 +0000'), title='End Time', group=BACKDATE)

string position                     = input.string("Bottom Right",
     options = [
             "Middle Right",
             "Top Center",
             "Top Right",
             "Middle Left",
             "Middle Center",
             "Bottom Left",
             "Bottom Center",
             "Bottom Right"],
     title = 'Position',
     inline = "001",
     group = DASHGROUP
     )

string textSize      = input.string("Normal",
     options = [
             "Tiny",
             "Small",
             "Normal",
             "Auto"],
     title = 'Size',
     inline = "001",
     group = DASHGROUP
     )

string MAXWHAT     = input.string("Winrate",
     options = [
             "Winrate",
             "Profit Factor",
             "PNL"],
     title = '=> Highlight Max',
     inline = "002",
     group = DASHGROUP
     )


bool EntryType      = input.string("Internal", title="=> Entry Type          ",
     options=["External", "Internal"],
     group=ENTRYG,
     inline = "00",
     tooltip = "Internal")
     == "Internal"

float external_indicator            = input.source(defval=close, title='         External indicator         ',
     group=EXT,
     tooltip=EXTIP,
     inline = "01")

float deal_start_value              = input.int(defval=100, title='         External Value               ',
     group=EXT,
     tooltip="Plot Value",
     inline = "02")


bool AOActive       = input.bool(false,"AO",group = INT,inline = "02")
bool MAActive       = input.bool(false,"MA",group = INT,inline = "02")
bool RSIActive      = input.bool(true,"RSI",group = INT,inline = "02")
bool MACDActive     = input.bool(false,"MACD",group = INT,inline = "02")
bool AroonActive    = input.bool(false,"Aroon",group = INT,inline = "06")
bool STActive       = input.bool(false,"SuperTrend",group = INT,inline = "06")
bool StochActive    = input.bool(false,"Stochastic",group = INT,inline = "06")
bool StochRSIActive = input.bool(false,"Stochastic RSI",group = INT,inline = "06",tooltip = "Indicators Activation")

int Aroonlength = input.int(14, minval=1,group = _AROON,title = "length",inline = "0001")
string AroonType                      = input.string("Crossover", title="Type",
     options=["Crossover", ">","<"],
     group=_AROON,inline = "0001"
     )

float AroonValue = input.float(40,"Value",group = _AROON,inline = "0001")

string AOType                      = input.string("Change to Green", title="Type",
     options=["Change to Green", ">","<"],
     group=_AO,inline = "0001"
     )

float AOValue = input.float(0.002,"Value",group = _AO,inline = "0001")

int RSIlength = input.int(14, minval=1,group = _RSI,title = "length",inline = "0001")
string RSIType                      = input.string("Crossover", title="Type",
     options=["Crossover", ">","<"],
     group=_RSI,inline = "0001"
     )

float RSIValue = input.float(40,"Value",group = _RSI,inline = "0001")

int MACDFast = input.int(12, minval=1,group = _MACD,title = "Fast",inline = "0001")
int MACDslow = input.int(26, minval=1,group = _MACD,title = "Slow",inline = "0001")
int MACDSmooth = input.int(9, minval=1,group = _MACD,title = "Smooth",inline = "0001")

string MACDType                      = input.string("Crossover", title="Type",
     options=["Crossover", ">","<"],
     group=_MACD,inline = "0002"
     )

float MACDValue = input.float(0.002,"Value",group = _MACD,inline = "0002")

int StochK = input.int(14, title="%K Length", minval=1,group = _STOCH,inline = "0001")
int StochSM = input.int(1, title="%K ", minval=1,group = _STOCH,inline = "0001")
int StochD = input.int(3, title="%D", minval=1,group = _STOCH,inline = "0001")
string StochType                      = input.string("Crossover", title="Type",
     options=["Crossover", ">","<"],
     group=_STOCH,inline = "0002"
     )

float StochValue = input.float(40,"Value",group = _STOCH,inline = "0002")

int StochRSIK   = input.int(14, title="K Smooth", minval=1,group = _STOCHRSI,inline = "0001")
int StochRSID   = input.int(1, title="D Smooth ", minval=1,group = _STOCHRSI,inline = "0001")
int StochRSILen = input.int(3, title="Length", minval=1,group = _STOCHRSI,inline = "0001")
string StochRSIType                      = input.string("Crossover", title="Type",
     options=["Crossover", ">","<"],
     group=_STOCHRSI,inline = "0002"
     )

float StochRSIValue = input.float(40,"Value",group = _STOCHRSI,inline = "0002")

int MA1 = input.int(7, title="MA1 Length", minval=1,group = _MA,inline = "0001")
string MAType  = input.string("SMA", title="Type", options=["SMA", "EMA", "SMMA (RMA)", "WMA", "VWMA"],inline="0001",group=_MA)
int MA2 = input.int(13, title="MA2 Length", minval=1,group = _MA,inline = "0001")
string MAType2  = input.string("SMA", title="Type", options=["SMA", "EMA", "SMMA (RMA)", "WMA", "VWMA"],inline="0001",group=_MA)

float factor = input.float(3,"Factor",group = _ST,inline = "0001")
int atrPeriod = input.int(14,"Period",group = _ST,inline = "0001")

string dynamicSelect  = input.string("ATR SL", title="SL Type                ",
     options=["ATR SL", "Pivot low", "VWAP SL"],
     group=DYNAMICSLG,inline = "02",
     tooltip = "Select how you want your Stoploss to be calculated")

float ATRSL           = input.float(1.,"ATR Factor           ",step = 0.1,
     group = DYNAMICSLG,
     inline = "03",
     tooltip = "Only used with ATR SL")

int LB                = input.int(8, minval=0,title="Pivot Lookback     ",
     group=DYNAMICSLG,
     inline = "04",
     tooltip = "looks for lower low ,Only used with Pivot Low")

float VWAPSL          = input.float(2.5,"Vwap Multiplier    ",step = 0.1,
     group=DYNAMICSLG,
     inline = "05",
     tooltip = "Gets the Vwap value ,Only used with Vwap SL")

CASH       = input.int(1,"Capital",group = RISKGROUP)
LV1        = input.float(0.618, step=0.01,title = "LV 1",group = RISKGROUP)
LV2        = input.float(1, step=0.01,title = "LV 2",group = RISKGROUP)
LV3        = input.float(1.414, step=0.01,title = "LV 3",group = RISKGROUP)
LV4        = input.float(2, step=0.01,title = "LV 4",group = RISKGROUP)
LV5        = input.float(2.414, step=0.01,title = "LV 5",group = RISKGROUP)
LV6        = input.float(3, step=0.01,title = "LV 6",group = RISKGROUP)
LV7        = input.float(3.414, step=0.01,title = "LV 7",group = RISKGROUP)

ShowTrades          = input.bool(true,"Show Trades" ,inline = "002",group = VISUAL)
ShowTP              = input.bool(true,"Show TP" ,inline = "004",group = VISUAL)
ShowHist            = input.bool(true,"Show histogram" ,inline = "005",group = VISUAL)

MAVG(source, length, type) =>
    switch type
        "SMA" => ta.sma(source, length)
        "Bollinger Bands" => ta.sma(source, length)
        "EMA" => ta.ema(source, length)
        "RMA" => ta.rma(source, length)
        "WMA" => ta.wma(source, length)
        "VWMA" => ta.vwma(source, length)

ConditionSwitcher(type,val1,val2,val3)=>
    switch type
        "Crossover" => ta.crossover(val1,val2)
        "Change to Green" => ta.crossover(val1,val2)
        ">" => val1 > val3
        "<" => val1 < val3

TIMEfrom_seconds(seconds) =>
    if seconds >= 86400
        string string = str.tostring(math.round(seconds / 86400, 1)) + ' days'
    else if seconds >= 3600
        string string = str.tostring(math.round(seconds / 3600, 1)) + ' hours'
    else
        string string = str.tostring(math.round(seconds / 60, 1)) + ' mins'

switchsize(size) =>
    switch size
        'Tiny'         => size.tiny
        'Small'        => size.small
        'Normal'       => size.normal
        'Auto'         => size.auto

switchPos(Pos) =>
    switch Pos
        "Middle Right"  => position.middle_right
        "Top Center"    => position.top_center
        "Top Right"     => position.top_right
        "Middle Left"   => position.middle_left
        "Middle Center" => position.middle_center
        "Bottom Left"   => position.bottom_left
        "Bottom Center" => position.bottom_center
        "Bottom Right"  => position.bottom_right

var DataTable          = table.new(switchPos(position),
      15,
      50,
      frame_color = color.white,
      frame_width = 0,
      border_width = 0
      )

G_Color(val)=>
    Pos = color.from_gradient(val,
         0,
         400,
         color.rgb(1, 165, 124),
         color.rgb(2, 85, 46, 24))
    Nig = color.from_gradient(val,
         -0,
         -400,
         color.red,
         color.orange)

    Col = val > 0  ? Pos : Nig

Cell(c,r,Text,bg)=>
    table.cell(DataTable,c,r,Text,
          bgcolor=bg,text_color = color.black,text_size = switchsize(textSize))

x2 = low - ta.rma(ta.tr(true), 14) * ATRSL
PVLOW =  ta.lowest(low,LB)
vwap = math.sum(ta.vwap(ta.tr(true)),14) * volume
volumz = math.sum(volume,14)
atr_vwap_volume = math.abs(vwap / volumz)
VWAPSLZ = low - atr_vwap_volume * VWAPSL

my_stop(SLC) =>
    switch SLC
        "ATR SL" => x2
        "Pivot low" => PVLOW
        "VWAP SL" => VWAPSLZ

sl = my_stop(dynamicSelect)

Aroonupper = 100 * (ta.highestbars(high, Aroonlength) + Aroonlength)/Aroonlength
Aroonlower = 100 * (ta.lowestbars(low, Aroonlength) + Aroonlength)/Aroonlength
ArronLONG = ConditionSwitcher(AroonType,Aroonupper,Aroonlower,AroonValue)

ao = ta.sma(hl2,5) - ta.sma(hl2,34)
diff = ao - ao[1]
AOLONG = ConditionSwitcher(AOType,diff,0,AOValue)

RSI = ta.rsi(close,RSIlength)
RMA = ta.sma(RSI,RSIlength)
RSILONG = ConditionSwitcher(RSIType,RSI,RMA,RSIValue)

[macdLine, signalLine, _] = ta.macd(close, MACDFast, MACDslow, MACDSmooth)
MACDLong = ConditionSwitcher(MACDType,macdLine,signalLine,MACDValue)

Stochk = ta.sma(ta.stoch(close, high, low, StochK), StochSM)
Stochd = ta.sma(Stochk, StochD)
StochLong = ConditionSwitcher(StochType,Stochk,Stochd,StochValue)

rsi1 = ta.rsi(close, StochRSILen)
StochRSIk11 = ta.sma(ta.stoch(rsi1, rsi1, rsi1, StochRSILen), StochRSIK)
StochRSId11 = ta.sma(StochRSIk11, StochRSID)
StochRSILong = ConditionSwitcher(StochRSIType,StochRSIk11,StochRSId11,StochRSIValue)

_MA1 = MAVG(close,MA1,MAType)
_MA2 = MAVG(close,MA2,MAType2)
MALong = ta.crossover(_MA1,_MA2)

[supertrend, direction] = ta.supertrend(factor, atrPeriod)
STlong = ta.crossunder(direction , 0)

internal = (MACDActive ? MACDLong : true) and
     (AroonActive ? ArronLONG : true) and
     (AOActive ? AOLONG : true) and
     (RSIActive ? RSILONG : true) and
     (StochActive ? StochLong : true) and
     (StochRSIActive ? StochRSILong : true) and
     (MAActive ? MALong : true) and
     (STActive ? STlong : true)


EXTDeal := if external_indicator == deal_start_value
    true

Backdate() =>
    in_date_range = true
    if limitRange
        in_date_range := time >= Stime and time <= Etime

    else
        in_date_range := true

longDiffSL = math.abs(close - sl)


ENTRY = switch
    EntryType => internal and Backdate()
    not EntryType => EXTDeal and Backdate()


GenCol(i)=>
    ColGen = color.new(color.rgb((20 * (i + 1)) % 255, (70 * (i + 1)) % 255, (120 * (i + 1)) % 255), 80)
    ColGen


Backtest(bool sig,tp,i) =>

    var active_trade = false
    var TP1 = 0.0
    var SL = 0.0
    var En = 0.0
    var label TO_lab = na
    if sig and not active_trade

        TP1 := close + (tp * longDiffSL)
        SL  :=  close - longDiffSL
        En  := close
        active_trade:= true
        BackTest.Col.set(i,color.new(GenCol(bar_index), 0))

    if active_trade

        BackTest.Signals.set(i,true)

        BackTest.PLOT.set(i,0,En)
        BackTest.PLOT.set(i,1,TP1)
        BackTest.PLOT.set(i,2,SL)
        if high >= TP1

            if ShowTP
                TO_lab:=label.new(bar_index - 5 ,
                     TP1,
                     "LV " + str.tostring(float(tp),format= "#.00"),
                     color = color.red,
                     style =  label.style_none,
                     textcolor = chart.fg_color,
                     size = size.small)
            tpValue = ((TP1 - En) / En) * 100

            PnlV = math.round(tpValue * CASH / 100,2)


            if BackTest.Maxprofit.get(i,0) < PnlV
                BackTest.Maxprofit.set(i,0,PnlV)
                BackTest.Maxprofit.set(i,1,bar_index)
                BackTest.Maxprofit.set(i,2,time)

            BackTest.MTX.set(i,0,BackTest.MTX.get(i,0)+1)
            BackTest.PNL.set(i,0,BackTest.PNL.get(i,0)+PnlV)
            active_trade := false
            BackTest.Signals.set(i,false)

        else if low <= SL
            slValue = -((En - SL) / En) * 100
            PnlV = math.round(slValue * CASH / 100,2)
            BackTest.MTX.set(i,1,BackTest.MTX.get(i,1)+1)
            BackTest.PNL.set(i,1,BackTest.PNL.get(i,1)+(PnlV))
            active_trade := false
            BackTest.Signals.set(i,false)

Backtest(ENTRY,LV1,0)
Backtest(ENTRY,LV2,1)
Backtest(ENTRY,LV3,2)
Backtest(ENTRY,LV4,3)
Backtest(ENTRY,LV5,4)
Backtest(ENTRY,LV6,5)
Backtest(ENTRY,LV7,6)

ReturnCal(val,val2) =>
    rtn = val + val2
    math.round((rtn / CASH) * 100,2)


PFCal(x,y)=>
    math.round(x/(-y),2)


array<string> Ratios  =
     array.from(
             str.tostring(LV1),
             str.tostring(LV2),
             str.tostring(LV3),
             str.tostring(LV4),
             str.tostring(LV5),
             str.tostring(LV6),
             str.tostring(LV7)
             )


if barstate.islast


    for i = 2 to 8
        Cell(i,0,i == 2 ? NAME : "",color.gray)

    table.merge_cells(DataTable, 2, 0, 8, 0)

    // lets build the columns
    for i = 0 to columns.size() -1
        Cell(i+2,1,columns.get(i),color.gray)


    for i = 0 to Ratios.size() -1
        Col = color.from_gradient(i,
             0,
             Ratios.size(),
             bottom_color = color.gray,
             top_color = color.gray)

        Cell(2,i+2,Ratios.get(i),Col)


for i = 0 to BackTest.MTX.rows() - 1
    Nut = color.from_gradient(
             i,
             0,
             BackTest.MTX.rows(),
             bottom_color =  color.gray,
             top_color = color.gray
             )


    for j = 0 to BackTest.MTX.columns() - 1
        Total = BackTest.MTX.get(i, 0) + BackTest.MTX.get(i, j)
        Cell(3,(i+1)+ 1,str.tostring(Total),Nut)
        if BackTest.MAXBOX.get(0)< Total
            BackTest.MAXBOX.set(0,Total)

        if j == 0
            Cell(4,(i+1)+ 1,str.tostring(BackTest.MTX.get(i, 0)),Nut)
        else
            Cell(5,(i+1)+ 1,str.tostring(BackTest.MTX.get(i, j)),Nut)
            Cell(6,(i+1)+ 1,str.tostring(math.round((BackTest.MTX.get(i, 0) / (BackTest.MTX.get(i, 0) + BackTest.MTX.get(i, j))) * 100,2)) +" %",Nut)
            BackTest.MAXWin.set(i,math.round((BackTest.MTX.get(i, 0) / (BackTest.MTX.get(i, 0) + BackTest.MTX.get(i, j))) * 100,2))


for i = 0 to BackTest.PNL.rows() - 1
    Nut = color.from_gradient(
             i,
             0,
             BackTest.PNL.rows(),
             bottom_color =  color.gray,
             top_color = color.gray)


    for j = 0 to BackTest.PNL.columns() - 1
        BackTest.MAXPF.set(i,PFCal(BackTest.PNL.get(i, 0),BackTest.PNL.get(i, j)))
        BackTest.MAXPNL.set(i,ReturnCal(BackTest.PNL.get(i, 0),BackTest.PNL.get(i, j)))
        Cell(7,(i+1)+ 1,str.tostring(PFCal(BackTest.PNL.get(i, 0),BackTest.PNL.get(i, j))) +" %",PFCal(BackTest.PNL.get(i, 0),BackTest.PNL.get(i, j))< 1 ? color.red: Nut)
        Cell(8,(i+1)+ 1,
             str.tostring(ReturnCal(BackTest.PNL.get(i, 0),BackTest.PNL.get(i, j))) + " %",
             G_Color(ReturnCal(BackTest.PNL.get(i, 0),BackTest.PNL.get(i, j))))

    tootip = "Max Profit : " + str.format("{0, number, currency}",BackTest.Maxprofit.get(i,0)) + "\n" +
         "Max % : " + str.tostring(math.round(BackTest.Maxprofit.get(i,0) / 100,2)) + " %" + "\n" +
         "Bar Index " + str.tostring(BackTest.Maxprofit.get(i,1)) + "\n" +
         "Time : " + str.format("{0,date,medium}",BackTest.Maxprofit.get(i,2))

    table.cell_set_tooltip(DataTable,2,i+2,tooltip = tootip)

method volAdj(int len)=>
    math.min(ta.atr(len) * 0.3, close * (0.3/100)) [20] /2

Adj = volAdj(30)

if MAXWHAT == "PNL"
    WinIndex = BackTest.MAXPNL.indexof(BackTest.MAXPNL.max())
    for i = 2 to 7
        table.cell_set_bgcolor(DataTable,i,(WinIndex+1)+ 1,BackTest.Colors.get("Select"))

if MAXWHAT == "Profit Factor"
    MAXS = BackTest.MAXPF.indexof(BackTest.MAXPF.max())
    for i = 2 to 7
        table.cell_set_bgcolor(DataTable,i,(MAXS+1)+ 1,BackTest.Colors.get("Select"))

if MAXWHAT == "Winrate"
    MAXSW = BackTest.MAXWin.indexof(BackTest.MAXWin.max())
    for i = 2 to 7
        table.cell_set_bgcolor(DataTable,i,(MAXSW+1)+ 1,BackTest.Colors.get("Select"))

plot(ShowTrades and BackTest.Signals.get(0) ? BackTest.PLOT.get(0,0) : na , color = BackTest.Colors.get("Black") ,style =plot.style_linebr)
plot(ShowTrades and BackTest.Signals.get(0) ? BackTest.PLOT.get(0,1) : na , color = BackTest.Col.get(0) ,style =plot.style_linebr)
plot(ShowTrades and BackTest.Signals.get(0) ? BackTest.PLOT.get(0,2) : na , color = BackTest.Colors.get("Red") ,style =plot.style_linebr)
plot(ShowTrades and BackTest.Signals.get(1) ? BackTest.PLOT.get(1,0) : na , color = BackTest.Colors.get("Black") ,style =plot.style_linebr)
plot(ShowTrades and BackTest.Signals.get(1) ? BackTest.PLOT.get(1,1) : na , color = BackTest.Col.get(1) ,style =plot.style_linebr)
plot(ShowTrades and BackTest.Signals.get(1) ? BackTest.PLOT.get(1,2) : na , color = BackTest.Colors.get("Red") ,style =plot.style_linebr)
plot(ShowTrades and BackTest.Signals.get(2) ? BackTest.PLOT.get(2,0) : na , color = BackTest.Colors.get("Black")  ,style =plot.style_linebr)
plot(ShowTrades and BackTest.Signals.get(2) ? BackTest.PLOT.get(2,1) : na , color = BackTest.Col.get(2) ,style =plot.style_linebr)
plot(ShowTrades and BackTest.Signals.get(2) ? BackTest.PLOT.get(2,2) : na , color = BackTest.Colors.get("Red") ,style =plot.style_linebr)
plot(ShowTrades and BackTest.Signals.get(3) ? BackTest.PLOT.get(3,0) : na , color = BackTest.Colors.get("Black") ,style =plot.style_linebr)
plot(ShowTrades and BackTest.Signals.get(3) ? BackTest.PLOT.get(3,1) : na , color = BackTest.Col.get(3) ,style =plot.style_linebr)
plot(ShowTrades and BackTest.Signals.get(3) ? BackTest.PLOT.get(3,2) : na , color = BackTest.Colors.get("Red") ,style =plot.style_linebr)
plot(ShowTrades and BackTest.Signals.get(4) ? BackTest.PLOT.get(4,0) : na , color = BackTest.Colors.get("Black") ,style =plot.style_linebr)
plot(ShowTrades and BackTest.Signals.get(4) ? BackTest.PLOT.get(4,1) : na , color = BackTest.Col.get(4) ,style =plot.style_linebr)
plot(ShowTrades and BackTest.Signals.get(4) ? BackTest.PLOT.get(4,2) : na , color = BackTest.Colors.get("Red") ,style =plot.style_linebr)
plot(ShowTrades and BackTest.Signals.get(5) ? BackTest.PLOT.get(5,0) : na , color = BackTest.Colors.get("Black") ,style =plot.style_linebr)
plot(ShowTrades and BackTest.Signals.get(5) ? BackTest.PLOT.get(5,1) : na , color = BackTest.Col.get(5) ,style =plot.style_linebr)
plot(ShowTrades and BackTest.Signals.get(5) ? BackTest.PLOT.get(5,2) : na , color = BackTest.Colors.get("Red") ,style =plot.style_linebr)
plot(ShowTrades and BackTest.Signals.get(6) ? BackTest.PLOT.get(6,0) : na , color = BackTest.Colors.get("Black") ,style =plot.style_linebr)
plot(ShowTrades and BackTest.Signals.get(6) ? BackTest.PLOT.get(6,1) : na , color = BackTest.Col.get(6) ,style =plot.style_linebr)
plot(ShowTrades and BackTest.Signals.get(6) ? BackTest.PLOT.get(6,2) : na , color = BackTest.Colors.get("Red") ,style =plot.style_linebr)
Hình 1: Chọn vào backtest date và chọn chu kỳ test mục I. Mục II chọn hiển thị thông số, vị trí bảng. Mục III, mặc định chọn internal là các thông số các mục B, ngược lại liên kết bên ngoài thì chọn mục A (liên kết chỉ báo khác với các thông số cài đặt riêng). Mục B thì chọn một hoặc nhiều chỉ báo để chọn điểm vào, nếu chọn nhiều sẽ an toàn hơn nhưng sẽ chờ lâu hơn, thường chọn 1 hoặc hai tín hiệu đồng thời có Winrate lớn nhất.
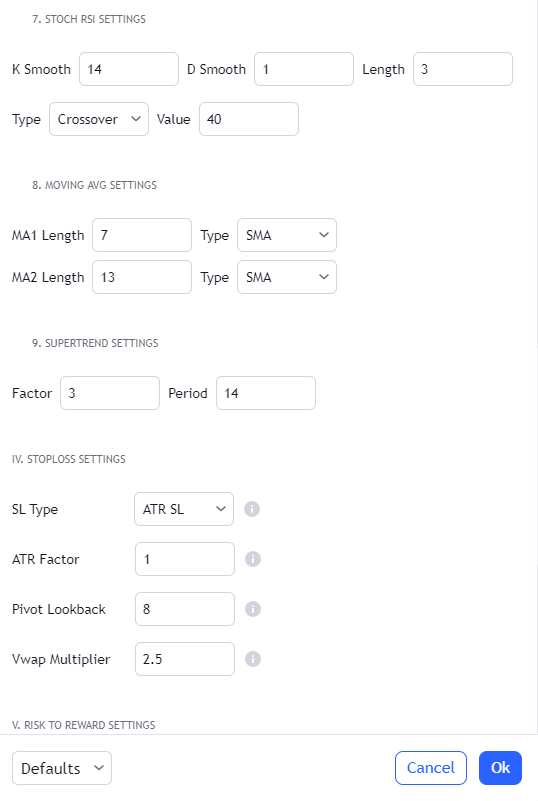
Hình 2: Cài đặt các thông số cho chỉ báo theo khẩu vị giao dịch.
Hình 3: Mục IV cài đặt các thông số cắt lỗ.
Hình 5: Mục V là các mức để tính xác suất trong quá khứ đạt ở các level cài đặt với xác suất win bao nhiêu. Nam đang để mặc định như thế cho chỉ số, còn cổ phiếu thường để 1-1.5-2-,…
Ví dụ cụ thể:
Mũi tên xanh lá chỉ điểm vào lệnh mua (đường ngang đen), đỏ chỉ điểm stoploss (đường ngang đỏ), tím chỉ các level cài đặt, màu thay đổi theo thuật toán viết trong script. Nên xem hai khung giờ và phân tích các ảnh hưởng khác để quyết định.
Hình bên dưới: Sử dụng script cùng chỉ báo RSI, chỉ báo xác suất, kênh xu hướng. Điểm đánh dấu tròn đỏ là điểm breakdown kênh xu hướng, gần breakdown đường MA tích lũy dài hạn, RSI đang bên dưới đường EMA, là điểm quan sát chứ không phải mua. Điểm tròn xanh biển là điểm gợi ý đảo chiều, cây nến sau đó là cây nến cho điểm mua (đường ngang đen), mua bao nhiêu tùy khẩu vị với xác suất lên mục tiêu khu 19k là 88%, và/hoặc đợi nhịp test mua thêm tùy theo diễn biến.
Hãy xem khu vực đánh dấu số 1 và 2, khu vực 2 đang tạo phân kỳ dương nhưng xác suất đang chỉ về thấp hơn, cho tín hiệu mua ở ngày đánh dấu nhưng mua hay không? mua tỉ trọng bao nhiêu và có quyết liệt cắt lỗ không?..